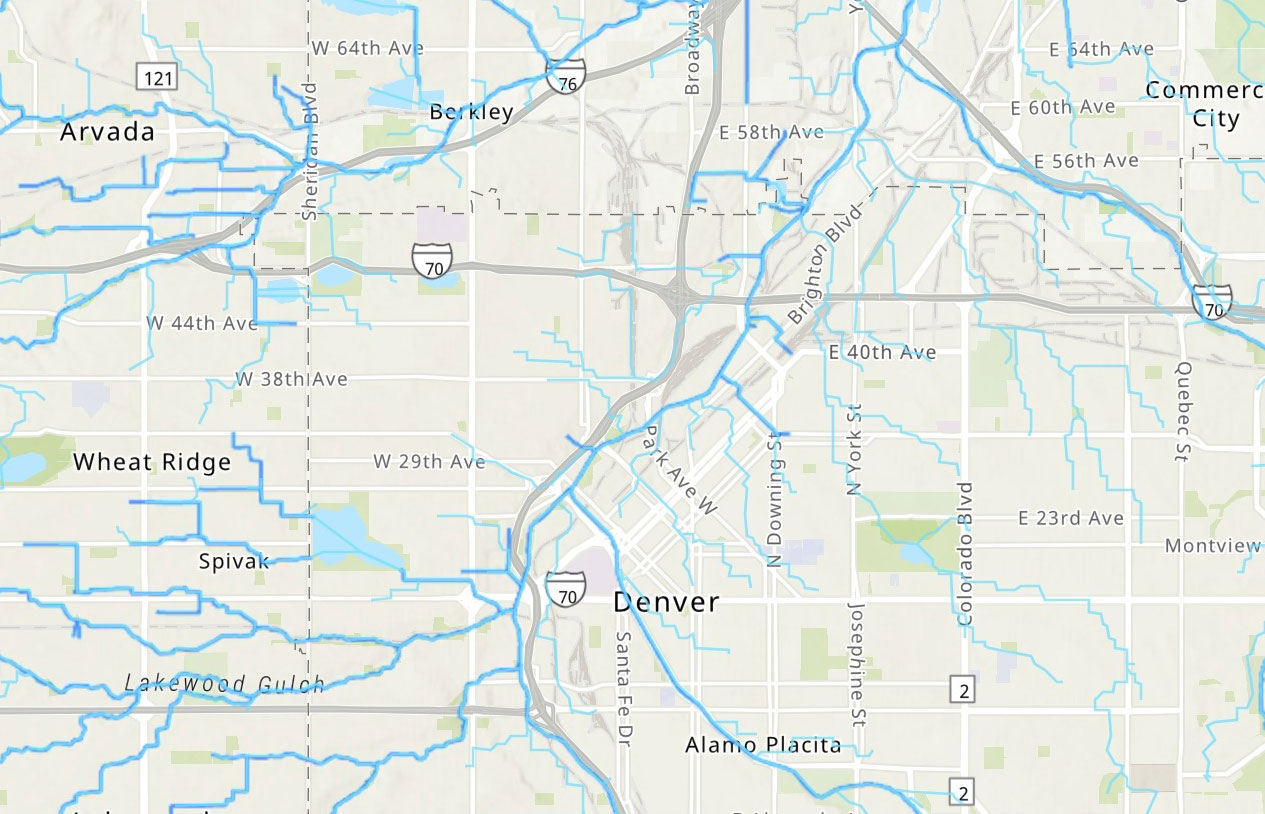
The Data Viewer map includes floodplain delineations, project/study limits, master-planned improvements, dam safety information, stream maintenance activities, maintenance eligibility status, boundaries, and more.
The Real-time Storm and Flood Data Map contains current warning information from the National Weather Service, live radar and lightning strike data, 1-hour storm track projections, and rainfall and stream level measurements from the ALERT System.
Find out if you live or work near a floodplain, areas identified as having high risk for flooding. Visit our floodplain map to view approximate floodplains. Mapped floodplains have a quantified risk of flood.
Explore ongoing and proposed projects near you. Projects aim to preserve the floodplain and riparian systems, restore degraded and damaged stream systems, and mitigate the effects of watershed urbanization with functional stream design.
MHFD’s service area is divided into eight regions based on stream systems and watershed boundaries. Use the Watershed map to find the appropriate MHFD contact based on location. The Construction Manager map identifies Construction Managers assigned to each county.
Stream Management Corridors (SMCs) represent the space needed to allow a stream to function in a way that replicates natural processes to the extent possible. Stream Management Corridorss should be considered when developing a site plan.
Share your experience and help us document flood events
Estimates of peak streamflow discharges that occurred during the September 2013 flood disaster. The map also features estimates of the corresponding flooding extents for some of the harder hit areas. Compare to mapped 100-yr floodplains.
We remove trash, tree limbs, and other junk such as tires and shopping carts out of the streams. Removing debris and obstructions from our streams keeps them beautiful, safe, and cleaner for recreational use. Click on a feature to view the schedule.
The idea of a regional flood control district came after a devastating flood on the South Platte River in 1965. See historic floodplain boundaries, approximate flooding extents (1965), and estimated rainfall (in) related to the flooding event.
The Colorado Association of Stormwater and Floodplain Managers (CASFM) leads an annual water quality field trip. We board a 55-passenger bus and visit good examples of water quality. This Story Map consists of locations and photos from our journeys.
Story map highlighting floods in the Front Range, with emphasis in Boulder CO dating back to the 1840’s. These flood events are considered noteworthy for loss of life, extent of property damage, and other unusual circumstances.
The Fluvial Hazard Zone (FHZ) is the area a stream has occupied in recent history, may occupy, or may physically influence as it stores and transports water, sediment, and debris. Fluvial Hazard Zone mapping represents a step forward in adaptively managing stream corridors, preparing for and mitigating flood impacts, and making informed land use decisions based on an awareness of fluvial processes.